Welcome to Hawatel's blog!
July 22, 2025 | General / Infrastructure management / Monitoring / Software
How does Grafana leverage AI?
Observability of IT systems is becoming increasingly complex. Large-scale applications, cloud environments, microservices, containers, and on top of that — the growing popularity of AI-based tools such as Large Language Models (LLMs) or vector databases. All of this means that IT teams must analyze ever-increasing volumes of data, detect problems faster, and simultaneously keep costs under control.
Fortunately, modern observability tools are keeping up with the times. A good example is Grafana, which not only helps with visualization and monitoring but increasingly leverages the potential of AI and machine learning to simplify the daily work of IT and DevOps teams.

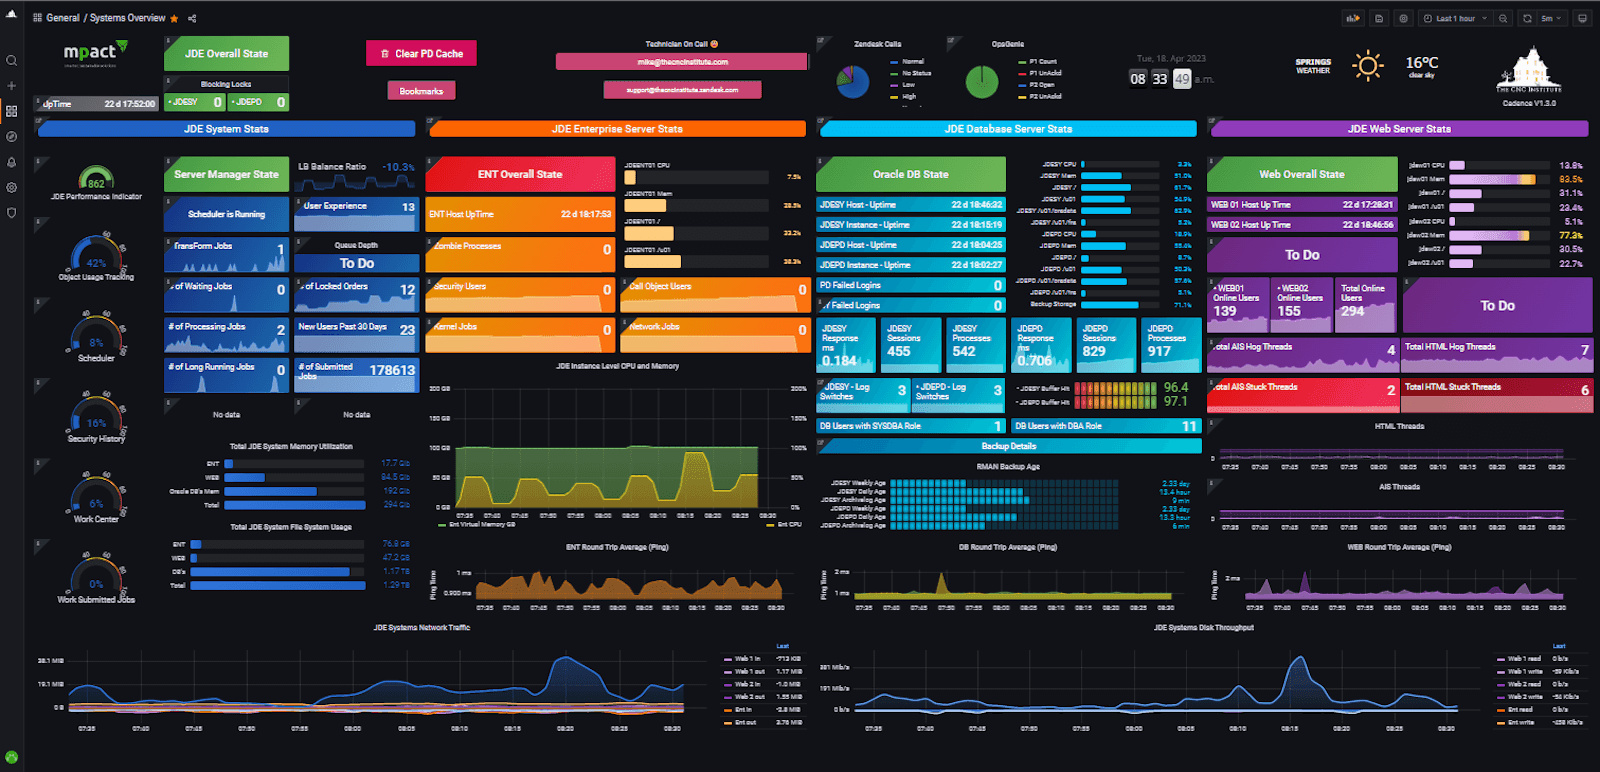
Source: Grafana Labs
AI in Grafana — no longer the future, it's the present
A few years ago, Grafana was primarily associated with dashboards and data visualization from sources such as Zabbix, Prometheus, Loki, Tempo, or Elasticsearch. Today, it’s much more than that — especially with the expansion of Grafana Cloud, which now offers advanced AI-powered features.
What exactly does AI bring to Grafana? Let’s look at some practical use cases.
- Reduced monitoring costs with adaptive metrics
Every organization that monitors metrics knows how quickly the volume of those metrics grows — and with that, so do the costs. That’s why Grafana Cloud introduced Adaptive Metrics — a tool that automatically analyzes collected data and identifies unused or rarely accessed metrics. These less critical metrics can be easily aggregated into simpler, less detailed versions, significantly reducing data volumes.
The result? According to Grafana Labs, organizations can reduce metric storage costs by an average of 35%.
- Faster problem detection — sift and AI-assisted analysis
Resolving incidents in IT environments can be time-consuming, especially when sifting through vast amounts of logs or monitoring data. That’s where Sift, Grafana Cloud’s intelligent diagnostic assistant, comes in.
Sift leverages AI and machine learning to automatically:
- Identify error patterns in logs
- Pinpoint Kubernetes container failures
- Detect so-called "noisy neighbors" in shared environments
- Provide one-click incident summaries with its auto-summary feature
Additionally, Grafana Cloud enables correlation of anomalies across different layers of the system — from applications to infrastructure.
- Monitoring AI and LLM systems with Grafana
The growing popularity of generative AI applications — such as chatbots or recommendation engines — brings new challenges in observability. That’s why Grafana Cloud is developing tools dedicated to environments using LLMs (Large Language Models) and vector databases.

What can you monitor with Grafana?
- User interactions with AI models — e.g., prompts and responses
- Token usage and costs related to LLMs
- Model response times and identification of potential bottlenecks
- Performance of vector databases (e.g., in search or recommendation apps)
- Model parameters, versions, and other metadata related to LLM queries
Importantly, Grafana emphasizes openness — tools such as the OpenLIT SDK are available, enabling telemetry data collection from AI systems and visualization within Grafana.
Everyday AI — less manual work for IT teams
Grafana also introduces features that simplify daily tasks, such as: automatic generation of dashboard titles and descriptions with LLMs, intelligent analysis of flame graphs to accelerate troubleshooting, GPU and AI infrastructure monitoring using eBPF (Grafana Beyla project).
This realistically saves time and allows teams to focus on solving problems rather than painstakingly digging through data.

Why does it matter?
Adopting AI in observability is not just a buzzword — it delivers tangible benefits:
- Faster incident detection and resolution (lower MTTR)
- Optimized monitoring and data storage costs
- Better control over AI environments and generative AI applications
- Increased automation of daily IT processes
Grafana Labs develops these solutions with an open-source mindset, avoiding vendor lock-in. This allows organizations to build flexible and scalable monitoring environments tailored to their specific needs.
Want to learn more or implement Grafana in your environment? Contact us! We’ll be happy to advise and assist with configuration.
See also:

Case Study | April 9, 2025
Custom data visualization in Grafana for an IT client using a custom-built plugin

Blog | March 25, 2025
The best data sources and extensions for Grafana: A small guide for administrators and DevOps
Blog | October 10, 2024
How can Grafana help your company better monitor key metrics?

Blog | September 16, 2024
Introduction to Grafana. Architecture and integration capabilities

Product