Monitoring
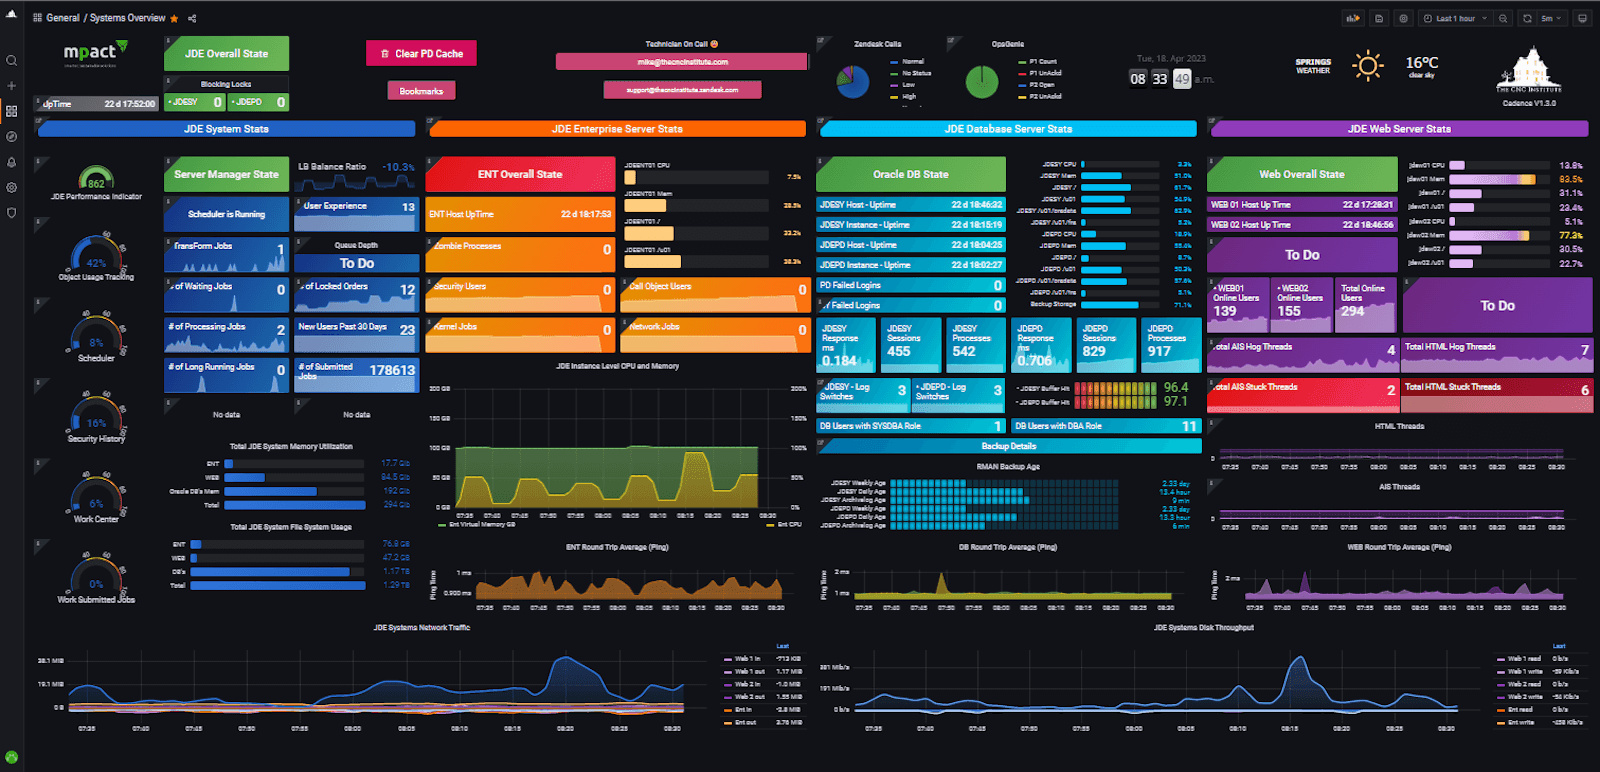
Custom data visualization in Grafana for an IT client using a custom-built plugin

An IT sector company faced the challenge of effectively monitoring data from the APN system, which required creating a custom visualization in Grafana using a proprietary plugin. As a result of this project, the client gained a unique tool that clearly presents key information, streamlining infrastructure management.
Challenge
The IT company needed a solution to visualize non-standard data from the APN system. Available tools on the market did not provide suitable mechanisms for presenting this information in a clear and accessible way.
The client was looking for a custom visualization that would allow for quick identification of connectivity issues at the regional level.
Solution
The implementation of the custom visualization in Grafana took four months and included several key stages. First, the structure of data provided by Dynatrace was analyzed, and the requirements for the final visualization were defined.
Next, a dedicated Grafana plugin was developed, enabling efficient processing and presentation of information in the form of an interactive map of Poland. This solution allowed for dynamic tracking of locations where connection outages occurred.
Results

- Interactive outage map – the visualization enables quick localization of issues at the regional level.
- A unique solution – with no ready-made tools available on the market, the client received a tailor-made tool suited to their specific needs.
- Improved IT infrastructure control – faster response to issues thanks to a clear and user-friendly data visualization.
Need a similar plugin or want to ask us something? Get in touch!
See also:

Blog | March 25, 2025
The best data sources and extensions for Grafana: A small guide for administrators and DevOps
Blog | October 10, 2024
How can Grafana help your company better monitor key metrics?

Blog | September 16, 2024
Introduction to Grafana. Architecture and integration capabilities

Product