Welcome to Hawatel's blog!
June 23, 2026 | General / Infrastructure management / Monitoring
Grafana LGTM stack as the foundation of modern observability architecture
Modern IT environments are significantly more complex than they were just a few years ago. Kubernetes, microservices, multi-cloud architectures, and distributed systems have made traditional infrastructure monitoring approaches insufficient. That is why more and more organizations are building observability platforms based on three telemetry pillars.
The three pillars: metrics, logs, and traces
Let’s recall what these three pillars are.
- Metrics - information about the state and performance of systems
- Logs - detailed event data
- Traces - tracking the flow of a transaction across multiple services
To understand the difference between metrics, logs, and traces, imagine a car journey from Warsaw to Gdańsk.
Metrics show the overall state of the trip - average speed, fuel level, engine temperature. Thanks to them, you know the car is driving at 120 km/h. This answers the question: “What is happening?”
Logs are a detailed event diary - for example: the engine was started at 8:03, at 9:17 a tire pressure warning light came on, at 10:42 the driver stopped at a gas station. Every event is recorded. This answers the question: “What events occurred and when?”
Traces, on the other hand, show the entire route step by step. You can see that the car left Warsaw, passed through Toruń, got stuck in a 15-minute traffic jam near Gdańsk, and finally reached its destination. If the trip took too long, the trace allows you to pinpoint exactly where the delay occurred. This answers the question: “How did the entire journey unfold, and where did the problem occur?”
One of the most popular open ecosystems implementing a similar monitoring model in the context of IT infrastructure is today the LGTM Stack, developed by Grafana Labs.

What is the LGTM Stack?
LGTM is an acronym derived from the four main components of the platform:
- Loki - log storage and analysis
- Grafana - data visualization and dashboards
- Tempo - distributed tracing
- Mimir - scalable metrics storage
In practice, the LGTM Stack is a complete observability platform enabling correlation of metrics, logs, and traces in a single environment.
As a result, operations teams do not need to switch between multiple tools when analyzing incidents or assessing the state of business services.
Loki - log management without indexing costs
Grafana Loki was created as an alternative to traditional log management platforms.
The biggest difference lies in the way data is stored.
While many systems index the full content of logs, Loki indexes only metadata (labels), while leaving the actual content in object storage.
This results in:
- lower infrastructure requirements
- reduced storage costs
- easier scalability
- simpler Kubernetes integration
For organizations processing hundreds of gigabytes of logs daily, this can mean a significant reduction in observability platform maintenance costs.

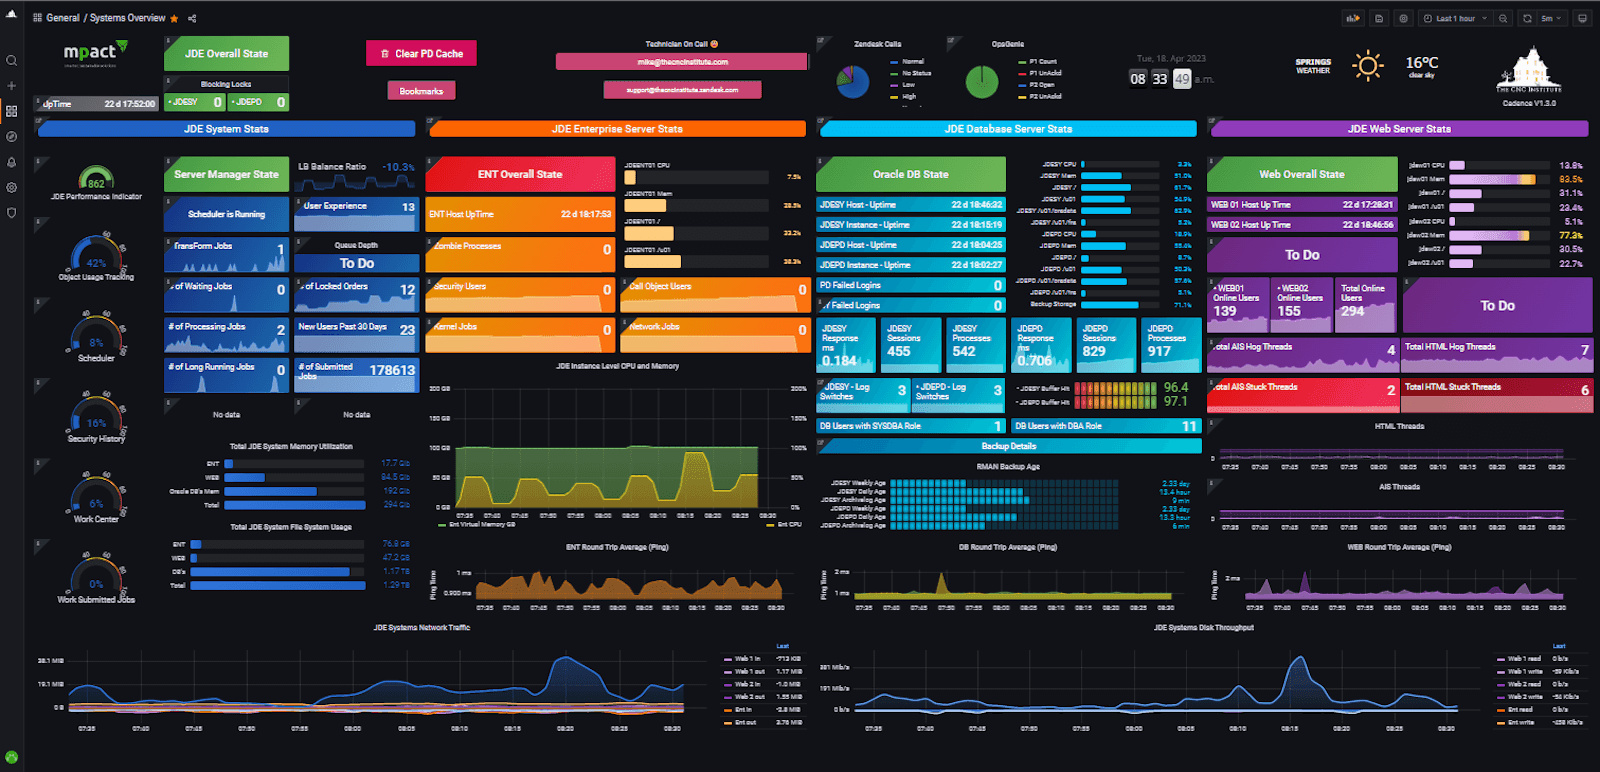
Grafana - the central visibility layer
Grafana is the visualization and analytics layer that brings all components of the LGTM Stack together in one place.
This is where operations teams, administrators, architects, and SRE engineers use dashboards, alerts, and analytical tools to observe the state of the entire IT environment.
However, its greatest value is not just creating charts.
Grafana enables correlation of data coming from different sources. A user can start analysis from a metric indicating a performance drop in a service, then move to related logs in Loki, and finally open a trace in Tempo to follow a specific transaction.

Source: Grafana
Tempo - distributed tracing at scale
In microservice architectures, a single business transaction may pass through dozens of services.
Tempo allows tracking the full lifecycle of such an operation, from the user entry point all the way to databases and external systems.
Thanks to distributed tracing, it becomes possible to:
- identify performance bottlenecks
- analyze dependencies between services
- reduce mean time to resolution (MTTR)
- monitor performance at the transaction level
Tempo is designed for very large data volumes and, like Loki, uses object storage for data retention.
Mimir - metrics at enterprise scale
As the number of systems grows, there is a need for centralization and scaling of metrics data.
Grafana Mimir addresses exactly this challenge.
In summary, if Loki stores event history, Tempo shows the full journey, and Mimir collects data about speed, fuel consumption, and engine temperature, then Grafana acts as the driver’s cockpit. This is where all information is presented in one place, enabling fast understanding of the situation and decision-making.

LGTM Stack and OpenTelemetry
The growing popularity of the LGTM Stack is closely tied to the development of OpenTelemetry.
OpenTelemetry is becoming the standard for collecting telemetry regardless of the software vendor used.
The combination of:
- OpenTelemetry
- Loki
- Tempo
- Mimir
- Grafana
enables building open observability platforms without vendor lock-in.
For organizations processing hundreds of gigabytes of logs daily, this can mean a significant reduction in observability platform maintenance costs.
The greatest value is not visualization itself. The key capability is the ability to move between metrics, logs, and traces within a single analysis flow.
An administrator can start from a performance alert, move to a specific trace, and then open related logs without leaving the Grafana interface.
This correlation model is the foundation of modern observability.
When does the LGTM Stack work best?
The LGTM Stack is primarily used in environments such as:
- Kubernetes and OpenShift
- microservices architectures
- multi-cloud environments
- hybrid environments
- regulated systems requiring long data retention
- environments with hundreds or thousands of monitored systems
Summary
The LGTM Stack is not a single product, but a complete observability architecture based on the open Grafana Labs ecosystem.
The combination of Loki, Grafana, Tempo, and Mimir enables centralization of metrics, logs, and traces while maintaining high scalability and cost control.
For organizations developing cloud-native environments, LGTM is becoming one of the key foundations of full operational visibility - from infrastructure, through applications, all the way to business transactions.
Are you planning to implement the LGTM Stack? Let's talk about the architecture.
See also:
Blog | February 18, 2026
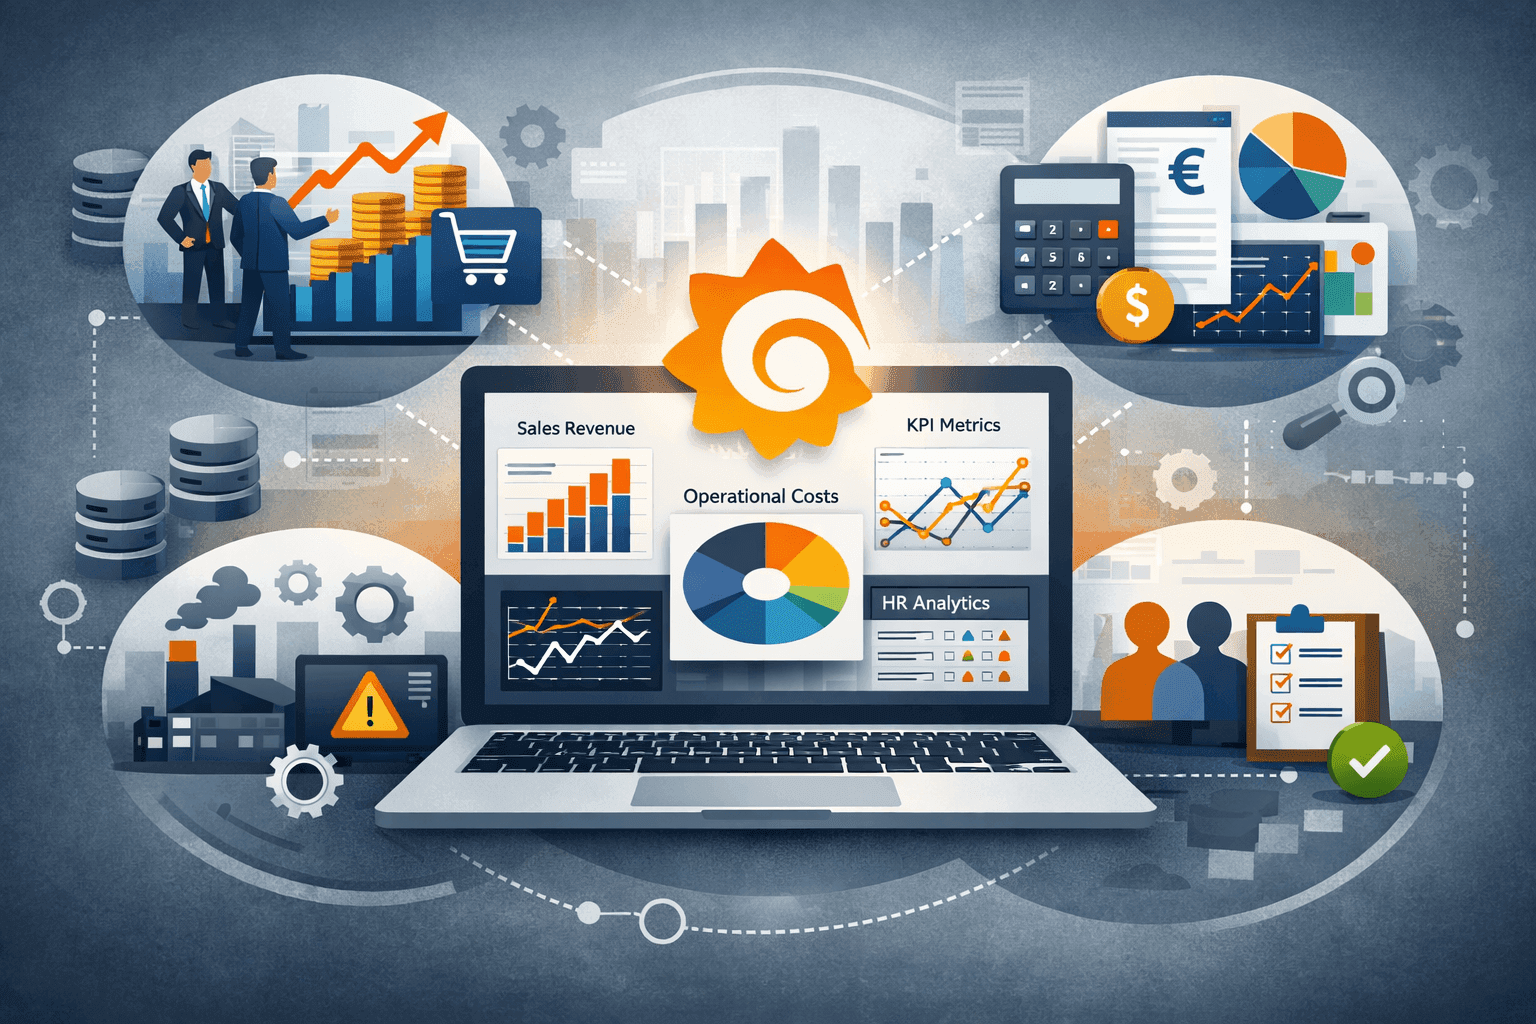
5 practical business use cases for Grafana (not just IT)

Blog | January 15, 2026
The new era of monitoring: How observability will transform Zabbix 8.0 LTS?
Blog | October 10, 2024
How can Grafana help your company better monitor key metrics?

Product