Welcome to Hawatel's blog!
April 23, 2026 | General / Infrastructure management / Monitoring
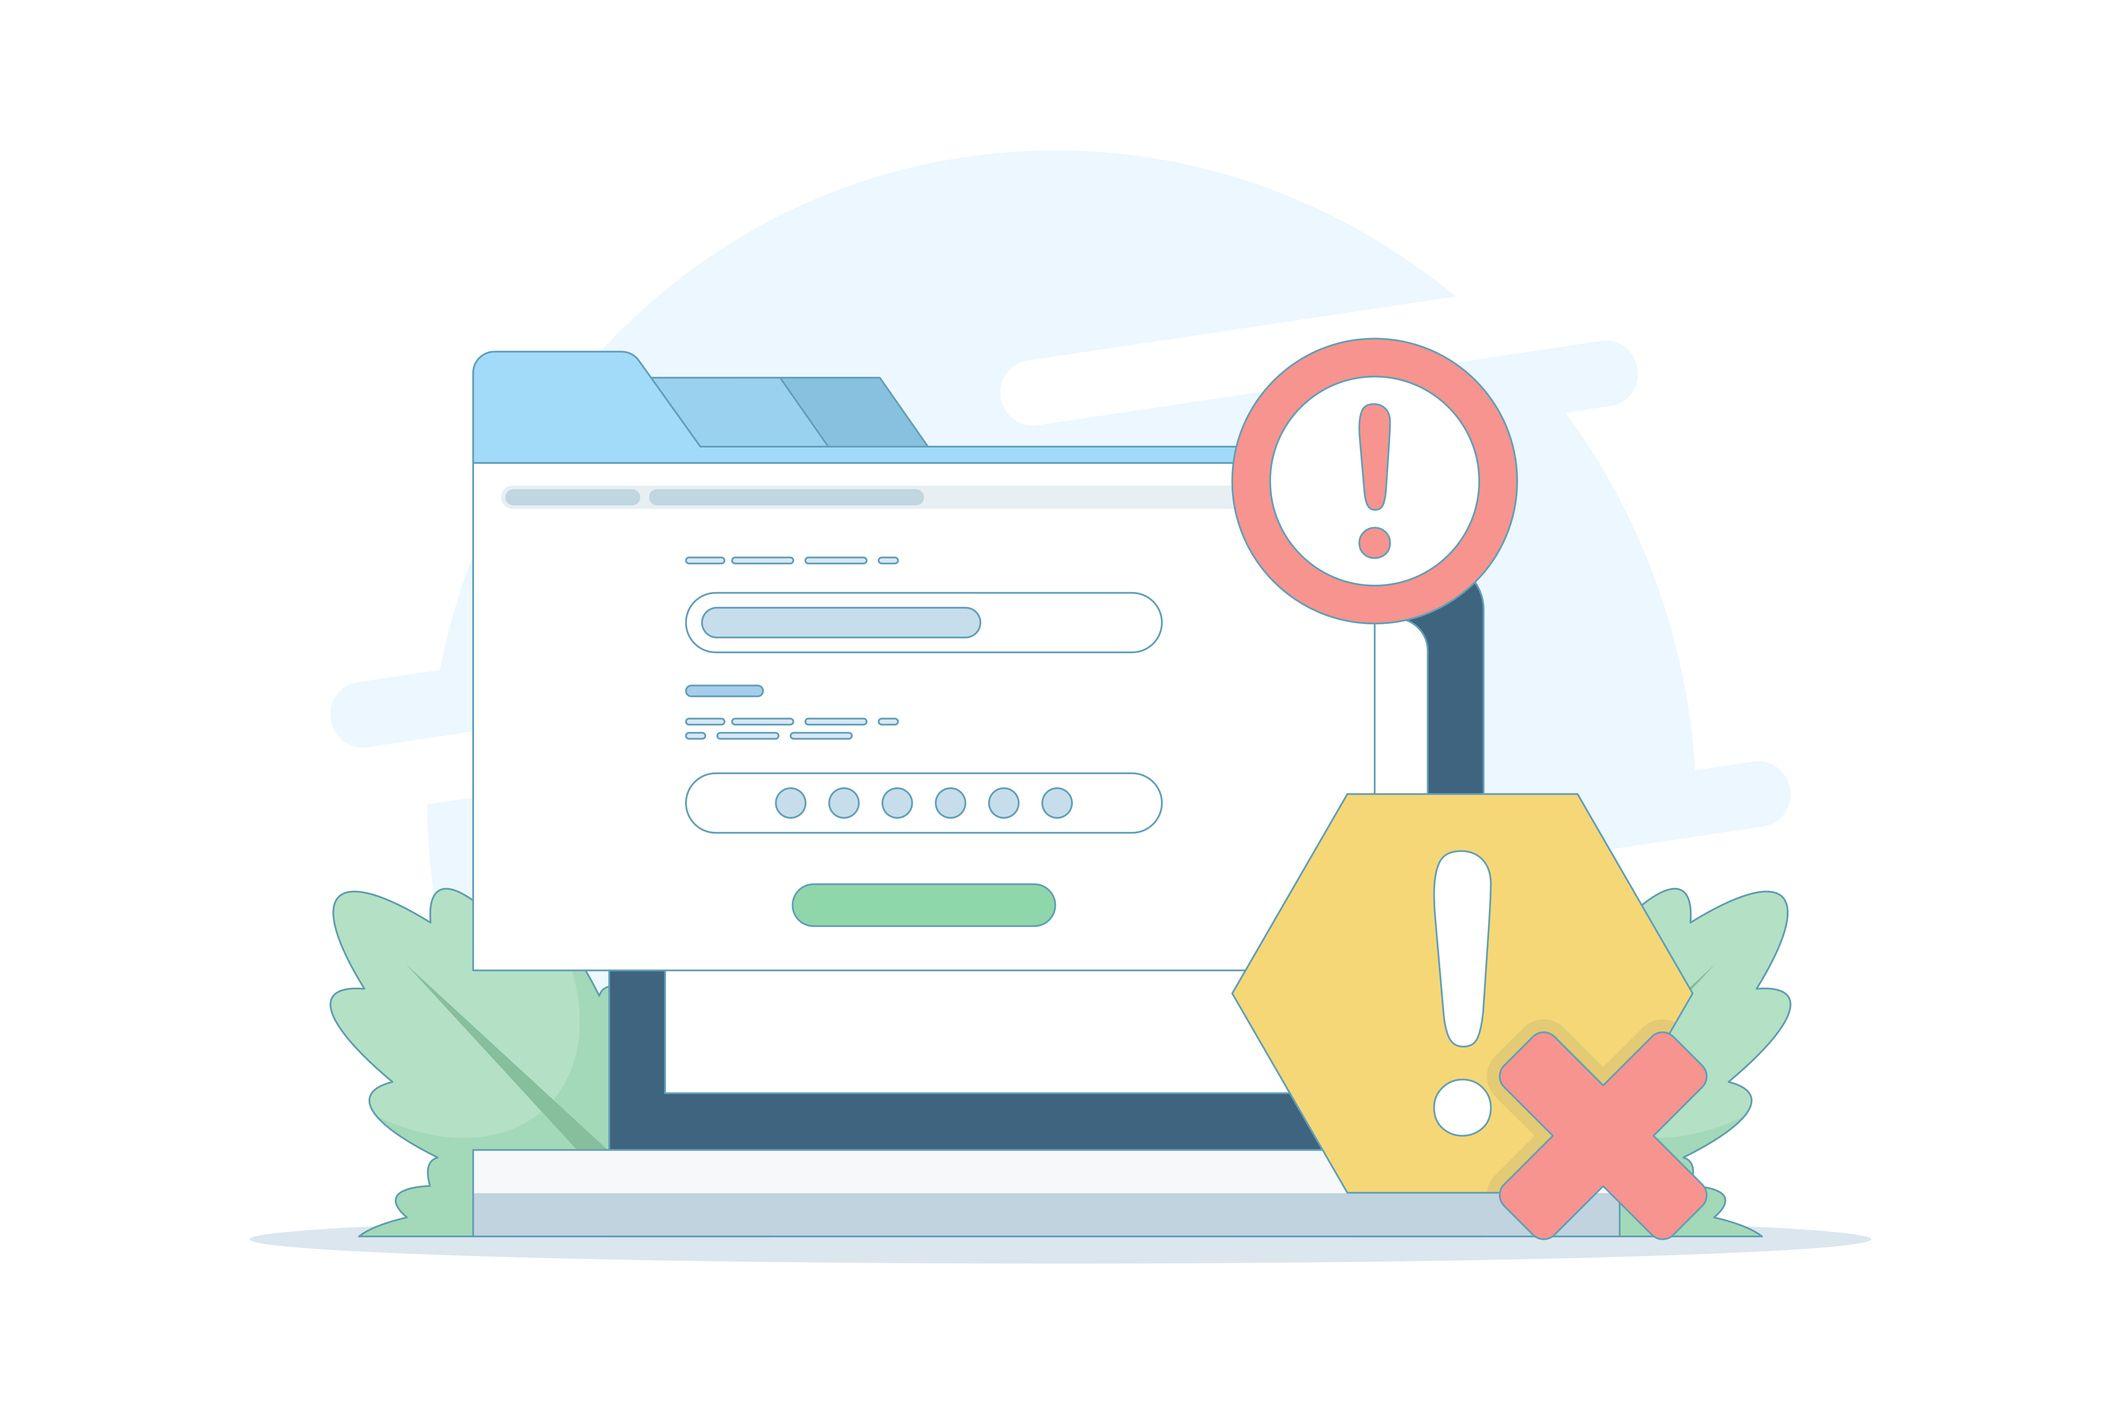
IT infrastructure monitoring works, until it starts to scale. What breaks at 1000+ hosts?
Monitoring designed for 100 hosts is not inherently poorly built. It works well in the environment it was designed for. As the company grows, over time it has to handle infrastructure it was never intended for 500, 1000 or more hosts. And that is exactly why it starts to break down quietly, gradually, in places that are hard to predict.
Scale is not just more hosts. It’s a different kind of problem.
When an IT environment consists of 50–100 servers, monitoring can be built in almost any way. A few templates, manually configured alerts, one engineer who knows all hosts by name. It really works, but only for a while.
The problem does not appear when something suddenly breaks, but when the environment grows by another 100, 200, 500 hosts. We add hosts, copy templates, add alert rules - each step feels natural. Monitoring “sort of works.” And then an incident happens, and it turns out nobody knows what is going on.
The difference between monitoring 100 and 1000+ hosts is not quantitative, but qualitative. It is a different engineering problem and requires a different architectural approach from the very beginning.
Area | 100 hosts | 1000+ hosts |
|---|---|---|
Alerts | Few, easy to review daily | Thousands per day—most ignored |
Configuration | Manual, manageable, engineer remembers what was done | Chaos—who changed what, when, and why? |
Root Cause Analysis | Check a few hosts and you know | Cross-team investigation, hours lost |
Service dependencies | Intuitively visible | Not mapped, revealed only during failures |
Knowledge base | In one person’s head | Nobody knows what matters and what doesn’t |
Problem 1: Alert explosion, when monitoring becomes noise
Context: Environment of 1200 hosts, each with 15–20 configured alert thresholds. In a system where load changes in daily cycles, maintenance windows are not always recorded, and frequent updates occur, hundreds of alerts appear daily.
The first symptoms of alert fatigue are always the same:
- Engineers stop reading alerts and start bulk-clearing them.
- Critical alerts are buried among hundreds of trivial notifications.
- “Eternal alerts” appear—same alerts active for weeks because nobody has time to handle them.
- Nobody knows which thresholds are current and which were set a year ago and no longer make sense.
The problem is not the tool. It lies in the architecture of alert rules, which was never designed for large scale. At 100 hosts, simple thresholds work: CPU > 80% for 5 minutes = alert. At 1000 hosts, such a rule generates dozens of false positives daily because somewhere CPU always spikes temporarily.
Alert fatigue is not about too many alerts. It is about lack of hierarchy, context, and priority. A thousand alerts can be handled if you know which three actually matter.
What breaks at this scale:
- Static thresholds: They stop working. Each host has a different load profile - you need dynamic, baseline-based thresholds.
- Lack of grouping and correlation: 10 alerts on hosts in one cluster represent one problem, not ten.
- Lack of ownership context: Who is responsible for this alert? Who should respond? Without this, alerts go to everyone and no one.

Problem 2: Configuration chaos - a monitoring that nobody understands
At 100 hosts, one experienced engineer can hold the monitoring configuration in their head. They know which templates are applied where, what exceptions exist, why one server has different thresholds. At 1000+ hosts, this model collapses for several reasons at once.
Configuration becomes impossible to audit
A thousand hosts, dozens of templates, hundreds of overridden parameters at host or group level. Nobody can answer: “Why does this server have a 90% threshold instead of 80%?” Change history does not exist or is incomplete.
Engineers leave, taking context with them
This is one of the most underestimated scaling risks. A person who built the monitoring system for two years leaves the company. They leave behind a system that technically works, but nobody understands why it is configured the way it is. Every change becomes a risk because dependencies are unknown.
“Living” templates mix with relics
In organically growing environments, monitoring templates are rarely cleaned up. Monitoring for a system that stopped existing two years ago still generates host downtime alerts. Templates built for old stacks are applied to new servers because “they look similar.” Over time, configuration becomes unmaintainable.

Problem 3: Slow RCA - when an incident costs hours instead of minutes
Root Cause Analysis (RCA), or finding the cause of an incident, is the moment where all weaknesses of monitoring become visible at once. In 1000+ host environments without proper architecture, RCA regularly takes hours.
A typical scenario: an application stops responding. The application team checks metrics, and everything looks fine. Escalation to infrastructure - servers are fine. Escalation to network - “all clean.” After 90 minutes, someone randomly checks logs on a specific node and finds a database connection error, which turns out to be caused by a storage issue.
Why is RCA so slow at scale?
- Data fragmentation: Metrics, logs, and alerts are in different places. Correlation requires manual stitching of information from three systems.
- No timeline: There is no unified incident timeline. It is unclear what happened first.
- No dependency map: Nobody knows which hosts depend on which. Every hypothesis must be verified from scratch.
- Reactivity: Logs are often analyzed after logging into servers and manually browsing files. At 1000+ hosts, this is simply impossible in reasonable time.
In mission-critical environments, the cost of slow RCA is not just engineering time. It is downtime, SLA erosion, contractual penalties, and loss of trust.

Problem 4: Unmapped service dependencies - the risk that only appears during failure
In a 100-host environment, service dependencies are usually simple and well understood. At 1000+ hosts, with dozens of applications, microservices, and middleware layers, the dependency map becomes so complex that nobody fully understands it anymore.
In enterprise environments, dependencies are far more complex than “application X uses database Y.” Examples:
- Application A uses API B, which uses queue C, which is fed by service D.
- Several seemingly independent applications share one database cluster.
- A load balancer serves production, staging, and a forgotten legacy environment.
- An SSL certificate expires in 3 days and serves 12 domains, but nobody knows which ones.
When this dependency network is not mapped, every failure triggers a chain of questions: what depends on what? What else might break? Can we safely restart this service, or will something else go down?

How to design monitoring for large scale?
The problems described above are not inevitable. They can be avoided, but it requires a change in mindset: monitoring is not a collection of tools, but a system designed to operate at 500, 1000, or 5000 hosts.
1. Monitoring-as-Code - configuration that evolves with infrastructure
Monitoring configuration should be versioned and treated like infrastructure code. Every change to alert thresholds, templates, or host groups should live in a repository with history and comments. This removes dependency on individual knowledge and introduces auditability.
In practice, this means integrating tools like Zabbix with declarative configuration systems (Ansible, Terraform, API-driven configuration) so that monitoring state is reproducible and defined outside the UI.
2. Dynamic thresholds and baselines instead of static values
At scale, static CPU > 80% thresholds stop making sense because different servers behave differently. A batch processing server regularly hitting 95% at night should not trigger alerts. An API server normally at 30% suddenly jumping to 70% should.
Monitoring must rely on baselines - normal behavior over time for a host or group. Deviation from baseline is more meaningful than fixed thresholds.
3. Alert hierarchy and clear ownership
Every alert must have an owner, either a team or person responsible for response. It must have a defined priority (P1, P2, P3) and an escalation path.
Without this hierarchy, monitoring becomes noise. With it, it becomes a decision system.
4. Central correlation: metrics + logs + traces as one context
Fast RCA is only possible when engineers see all signals in one place on a shared timeline: metrics, logs, and traces synchronized by host, service, and time.
This is the foundation of observability: not three separate views, but one coherent picture of what happened and when.
5. Dependency map as a living infrastructure document
A dependency map is not a one-time project. At scale, it must be generated automatically from network traffic, load balancers, Kubernetes services, and application metadata. The more automated it is, the more reliable it becomes.
A good map allows you to answer in seconds: “If this component fails, what else will be impacted?”

Scale is an architectural test, not a tooling test
Every monitoring tool works fine at 100 hosts. The real test begins at a few hundred and becomes ruthless at 1000+.
Organizations that design monitoring for scale from the start, using infrastructure-as-code, dynamic thresholds, alert hierarchies, and centralized correlation don’t suddenly encounter these problems. They see them early and manage them before they become incidents.
Organizations that grow monitoring organically, adding hosts to a system designed for a much smaller environment, eventually stop seeing clearly. They have monitoring, but not visibility.