What is profiling?
Profiling is an observability technique that shows how an application uses computing resources, primarily CPU and memory, down to a specific function or even a line of source code. Instead of simply knowing that “service X is using a lot of CPU,” profiling answers the question: “Why?” The answer might be a function such as parseJSON(), which in the payment module performs unnecessary memory allocations with every request.
Code profiling itself is nothing new. Developers have been using profilers for decades to improve performance locally (during debugging) on their own machines. The problem is that traditional profiling is reactive: you have to manually start the profiler when the problem occurs. In practice, this means that intermittent, difficult-to-reproduce performance issues in production often go unnoticed.
Continuous profiling
The answer to these limitations is continuous profiling. Instead of running a profiler only when needed, the system profiles the application continuously, in the background, in production, with minimal performance overhead - typically less than 2–3% additional CPU usage. Through low-overhead sampling, data is collected continuously and stored in a dedicated database for later analysis.
As a result, profiling stops being an “on-demand” tool and becomes part of continuous monitoring, just like metrics or logs. If a sudden spike in memory usage occurs at 3 a.m. on Wednesday, you do not need to catch it live. You can simply go back in time and inspect the profiles collected during that period.
Continuous profiling data is also enriched with two important dimensions:
- Time - data is collected continuously, allowing you to query application performance from any point in the past.
- Contextual metadata - such as service name, version or region, allows you to filter and compare profiles across deployments, environments or instances.

Source: Grafana
How does profiling complement the other pillars?
In short:
- Metrics tell us that “something” is wrong (e.g. high CPU usage)
- Logs tell us what happened at a specific moment
- Tracing shows which service/request is the bottleneck
- Profiling shows which function/line of code is consuming resources
Each of these pillars answers a different question. To see how they work together in practice, imagine a problem on a production line in a factory.
Metrics
An alert appears on the manager’s dashboard: electricity consumption on production line No. 2 has dropped by 25%. Something is clearly wrong.
Logs
The event log shows that at 10:17, a section of the line responsible for assembling packaging reported an error and switched to emergency mode.
Tracing
You follow the path of a single item through the successive workstations and see that the biggest delay occurs at workstation No. 7.
Profiling
You analyze the robot operating at workstation No. 7 and discover that checking the weight of each package three times accounts for most of the workstation’s processing time. That is the direct cause of the slowdown.
How does Pyroscope work?
Grafana Pyroscope is an open-source system for aggregating continuous profiling data. It was created through the merger of two projects: Pyroscope, founded in 2020 by Ryan Perry and Dmitry Filimonov, and Phlare, a project developed by Grafana Labs, which acquired Pyroscope in 2023 and combined the two tools under a single name.
Key architectural features include:
- Single binary - Pyroscope can run as a single process without additional dependencies, making it easy to get started.
- Horizontal scalability - its distributed architecture allows Pyroscope to scale as the number of profiled services grows.
- Persistent, long-term storage of profiling data, enabling trend analysis over time.
- OpenTelemetry Protocol compatibility, aligning with the broader trend toward standardization in observability.
It is also worth mentioning a major architectural change introduced in Pyroscope 2.0, released in April 2026. In version 1.x, each profile was replicated three times along the write path. With profiles often weighing tens of megabytes, this generated significant storage and infrastructure overhead. Pyroscope 2.0 eliminates this replication entirely. Each profile is written exactly once, directly to object storage, which becomes the single source of truth for distributed deployments.
The query path has also been simplified. Query processing is now stateless, allowing computing resources to be scaled dynamically instead of being provisioned “just in case” for peak workloads.

Source: Grafana
Data collection process
In practice, Pyroscope works as follows:
- Application instrumentation. A profiling agent is attached to the application or its runtime environment. This can be a library embedded in the application code (SDKs are available for Go, Java, Python, Ruby, .NET and other languages) or an eBPF-based profiler operating at the operating-system level without requiring changes to the application code.
- Sampling. The agent periodically - for example, 97 times per second - takes a “snapshot” of the call stack of each application thread. It checks which function is currently executing and its complete call chain.
- Sample aggregation. The collected samples are aggregated locally and periodically sent to a Pyroscope server (or to Grafana Cloud Profiles as a managed service).
- Storage in the profiling database. The Pyroscope server stores the data in a specialized database optimized for profiling data - large, dense structures representing call stacks over time.
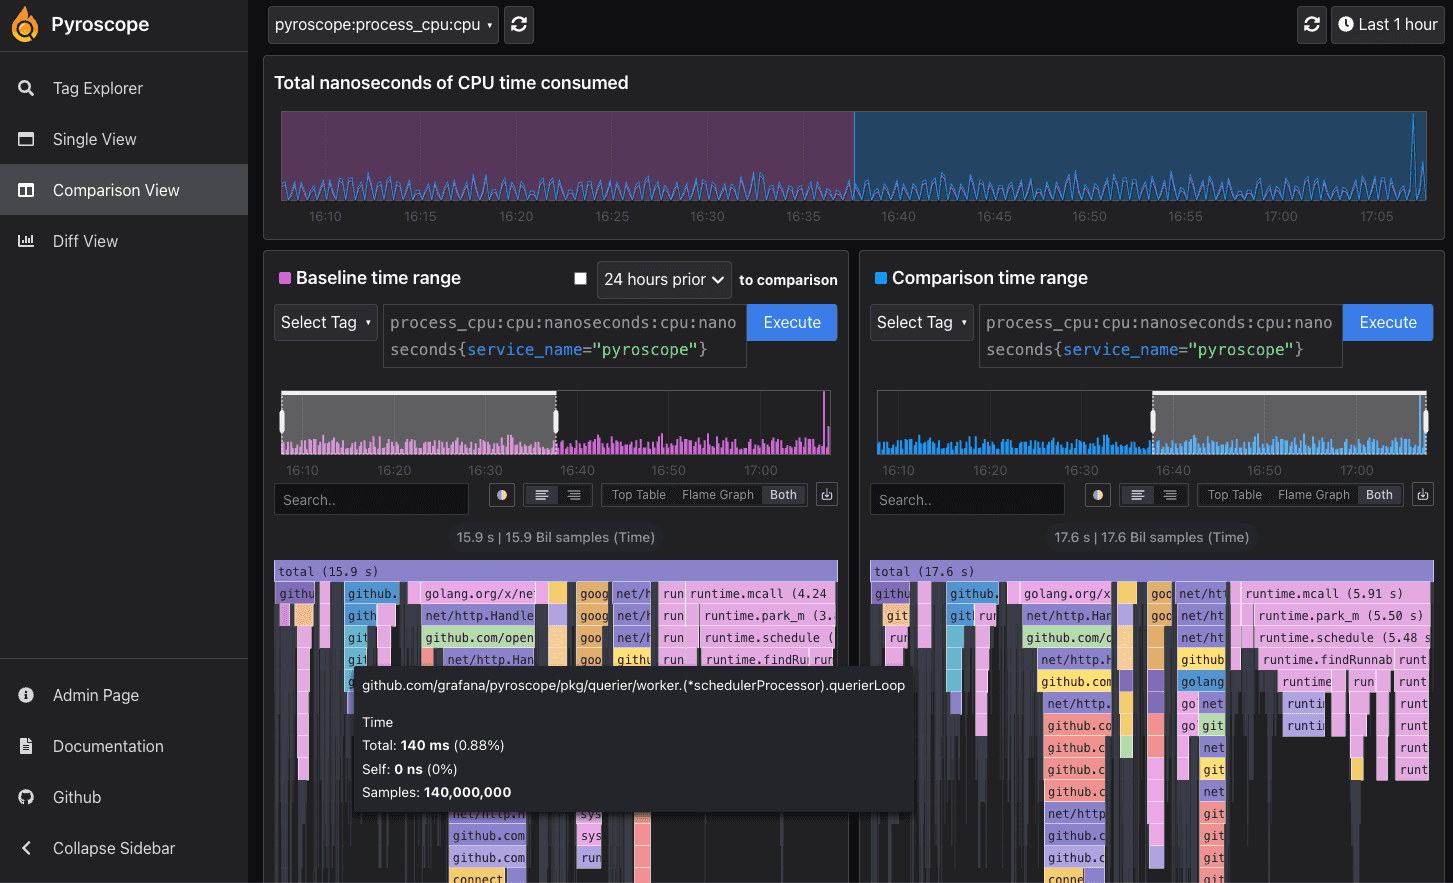
- Visualization and querying. The data can be explored in Grafana. Tools such as Grafana Profiles Drilldown can be used for exploration, while profiling data can be queried using the dedicated query language, FlameQL.
One of Pyroscope’s biggest advantages is the ability to connect profiles with traces from Tempo through a feature known as span profiles. This means that when you identify a slow span in distributed tracing, you can immediately see the profile of that exact part of the request and drill down to the line of code responsible for the delay, instead of having to guess based solely on the span duration.

Source: Grafana
Why does all of this matter?
Continuous profiling extends observability to the code level. This allows teams not only to detect performance issues but also to identify their source with much greater precision.
Instead of simply adding more server instances when CPU usage increases, teams can pinpoint the exact line of code responsible for the problem and fix the underlying cause rather than the symptom.
In practice, this translates into:
- Lower infrastructure costs, by eliminating code inefficiencies instead of scaling up hardware.
- Lower latency, because precisely locating bottlenecks makes them faster to eliminate.
- Shorter incident resolution times (MTTR), because instead of searching for the root cause “in the dark,” engineers can immediately see which function is responsible for the spike in resource consumption.
Summary
Profiling completes the observability picture. With continuous profiling, implemented through tools such as Grafana Pyroscope, teams can continuously monitor how an application uses CPU and memory down to a specific line of code - and go back in time to investigate incidents that occurred before anyone had a chance to manually start a profiler.
That is what makes profiling a fully-fledged fourth pillar of modern observability.