Home

Insights

We provide the knowledge base required to make informed decisions!

Grafana Pyroscope
GeneralInfrastructure managementMonitoring

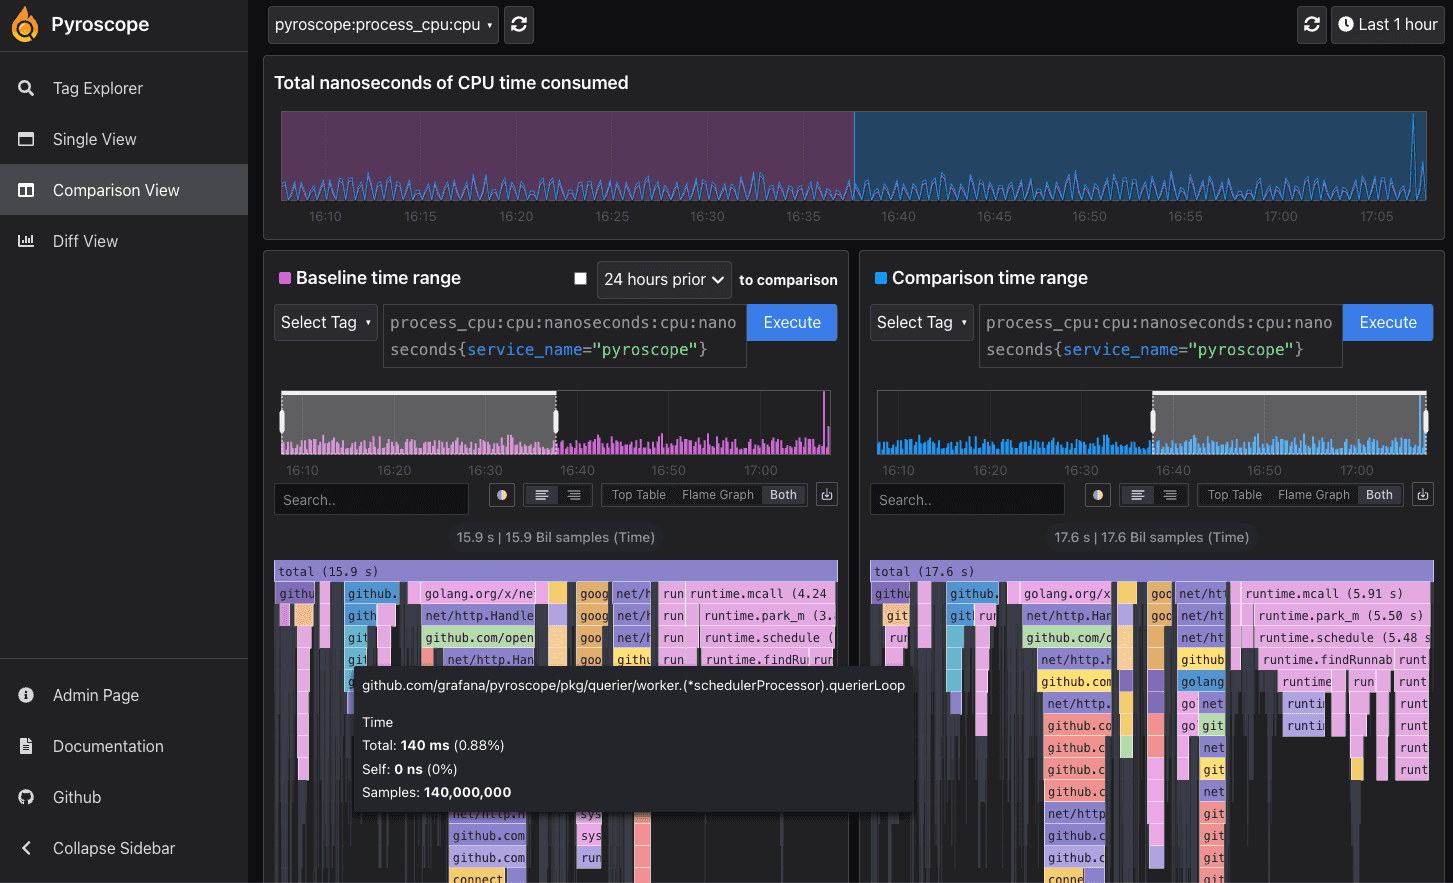
The fourth pillar of observability: What is profiling and how does Grafana Pyroscope work?

Observability is based on three pillars, the so-called “metrics, logs and traces”. Metrics tell us that something is wrong (e.g. a spike in CPU usage), logs help us understand what happened at a specific moment, while tracing shows which service in a distributed system is the bottleneck. Recently, however, a fourth level of detail has been added to these three pillars - profiling. It tells us exactly which function, and even which line of code, is consuming specific resources.

Read more

Welcome to our blog!

Grafana Pyroscope

The fourth pillar of observability: What is profiling and how does Grafana Pyroscope work?

Observability is based on three pillars, the so-called “metrics, logs and traces”. Metrics tell us that something is wrong (e.g. a spike in CPU usage), logs help us understand what happened at a specific moment, while tracing shows which service in a distributed system is the bottleneck. Recently, however, a fourth level of detail has been added to these three pillars - profiling. It tells us exactly which function, and even which line of code, is consuming specific resources.

Read more
Grafana_LGTM_stack_observability

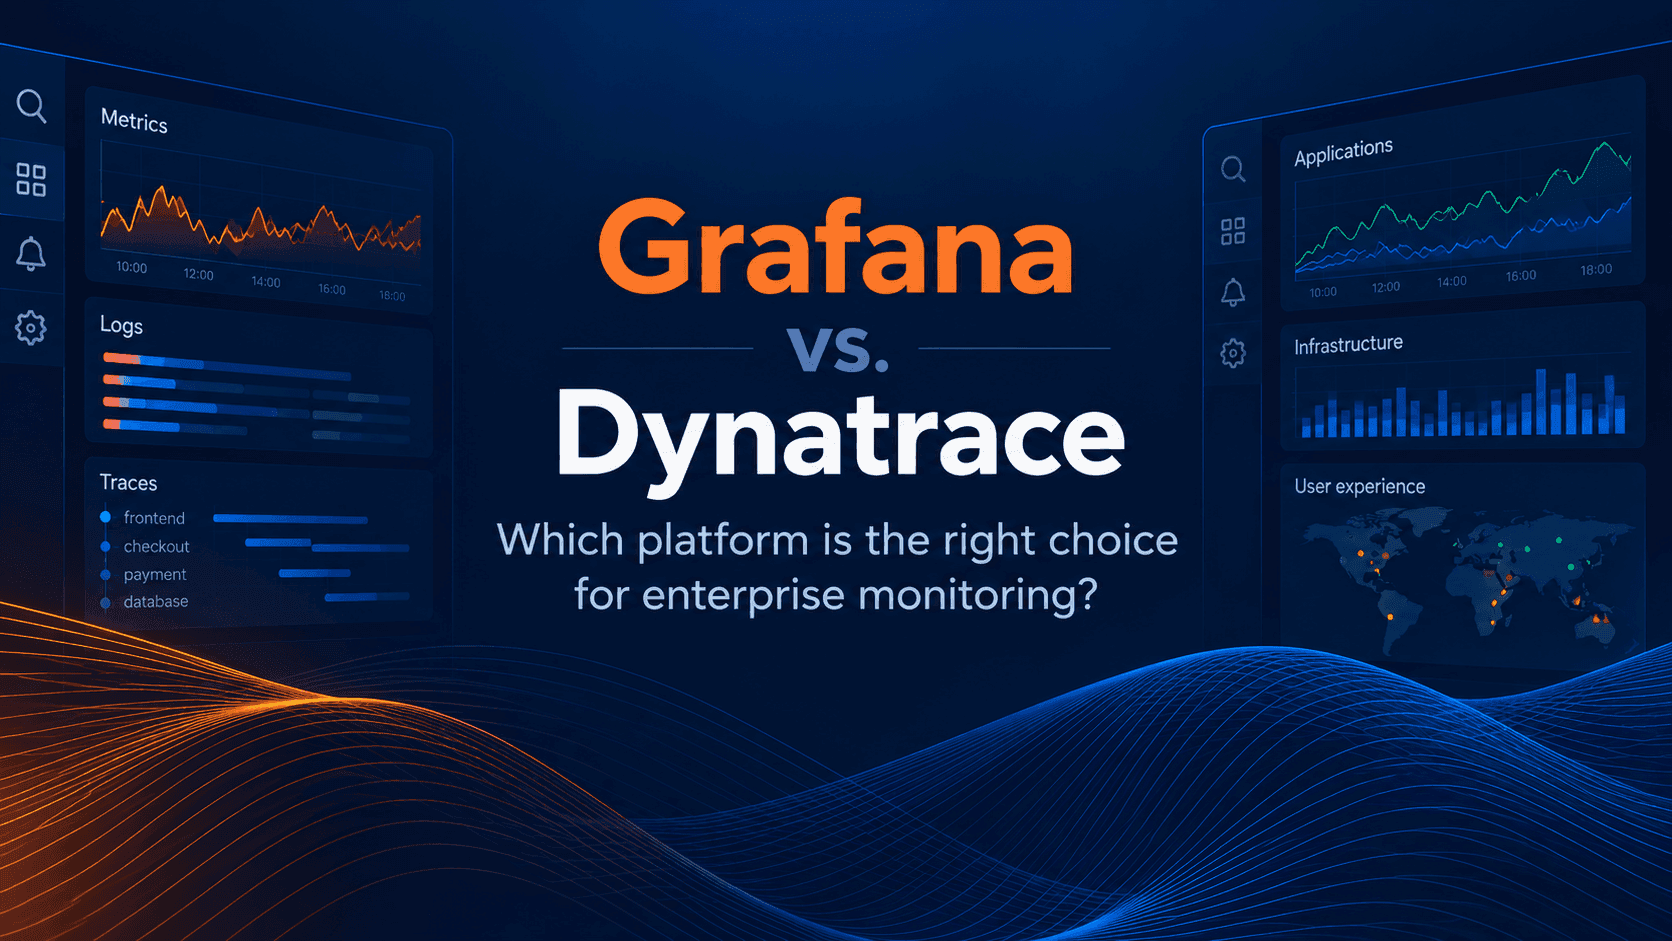
Grafana LGTM stack as the foundation of modern observability architecture

Modern IT environments are significantly more complex than they were just a few years ago. Kubernetes, microservices, multi-cloud architectures, and distributed systems have made traditional infrastructure monitoring approaches insufficient. That is why more and more organizations are building observability platforms based on three telemetry pillars.

Read more
Monitoring syntetyczny aplikacji webowych i serwisów www.jpg

Synthetic monitoring of web applications and online services

The infrastructure is working. All servers are green. Databases are responding. And yet, at 09:14 in the morning, the customer support department receives a call: I can’t log in to the application. Your monitoring saw nothing. But the user saw everything.

Read more
Contact icon

Get in touch with us!

If you want to learn more about our services, inquire about job opportunities, or ask a technical question, you're in the right place!

Direct contact with a senior architect.